Using AnalysisReports with Swagger ui and GroupShare REST API

Hello!

I have successfully accessed GroupShare Rest API (example: http://[myserver]:41234/documentation/api/index#/), used Login to receive token, used ProjectsV2 to get projects on our server, and then tried using AnalysisReports with one of the ProjectID.  I receive response code 200, but response body only comes back [].  How can I get a json containing an array of report details?

I have verified project exist on the server and few files are in that project...


Any help would be very much appreciated!!

Thanks,

Rieko

Parents
  • Hi  

    You can see the Analyse response result from browser. Are you familiar with Fiddler? You can download it from here . Is a very useful tool you can see the request and response to any API. 


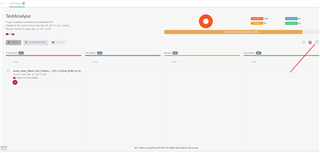
    In order to see the Analyse, you need to switch to Analyse View, please see photo bellow: 

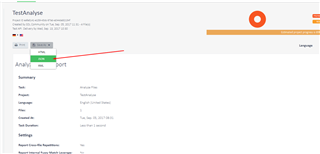
    To see the analyse response as Json, select from "Save As" button JSON option.


    After you selecte JSON option please go to Fiddler (please make sure Fiddler is opened before you Select Analyse). 

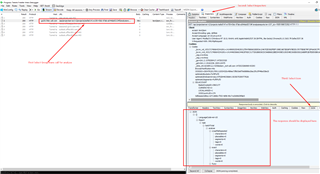
    In the picture you can see a example of response in Fiddler.

    Short explication on how to use it:

    1. In the left side you can see the web requests (this records all the web requests), in the list search for the call which matches to GS analyse call.

    2. In the right side select "Inspectors" , and under "Inspectors" you have another tab "Headers", please select it too. In that region you'll be able to see reqquest details.

    3. The response from the API you can see it under the region with Request Headers. Select "Json" from the tab and now you should be able to see the Analyse Result response Json.


    If you have any questions do not hesitate to ask.


    Kind regards,

    Andrea.

Reply
  • Hi  

    You can see the Analyse response result from browser. Are you familiar with Fiddler? You can download it from here . Is a very useful tool you can see the request and response to any API. 


    In order to see the Analyse, you need to switch to Analyse View, please see photo bellow: 

    To see the analyse response as Json, select from "Save As" button JSON option.


    After you selecte JSON option please go to Fiddler (please make sure Fiddler is opened before you Select Analyse). 

    In the picture you can see a example of response in Fiddler.

    Short explication on how to use it:

    1. In the left side you can see the web requests (this records all the web requests), in the list search for the call which matches to GS analyse call.

    2. In the right side select "Inspectors" , and under "Inspectors" you have another tab "Headers", please select it too. In that region you'll be able to see reqquest details.

    3. The response from the API you can see it under the region with Request Headers. Select "Json" from the tab and now you should be able to see the Analyse Result response Json.


    If you have any questions do not hesitate to ask.


    Kind regards,

    Andrea.

Children
No Data