

Dear All,
We would like to monitor the time taken by each and every of our reports that are generated in order to follow up on potential non-optimized queries used in the reports.
I know it's possible to activate the Audit and Monitoring features in the Jasper server so I followed the instructions detailed in this article: https://community.jaspersoft.com/documentation/jasperreports-server/tibco-jasperreports-server-administration-guide/v820/jasperreports-server-admin-guide-_-diagnostics-_-configuring_auditing_and_monitoring/#top (including enabling CLOB fields: https://community.jaspersoft.com/documentation/jasperreports-server/tibco-jasperreports-server-administration-guide/v820/jasperreports-server-admin-guide-_-configuration-_-configuring_domains/#Enabling_CLOB_Fields)
However, when I wan to test these features (see article: https://community.jaspersoft.com/documentation/jasperreports-server/tibco-jasperreports-server-administration-guide/v820/jasperreports-server-admin-guide-_-diagnostics-_-using_the_audit_data/), I cannot find the "Audit" and "Monitoring" folders in the Public repository:
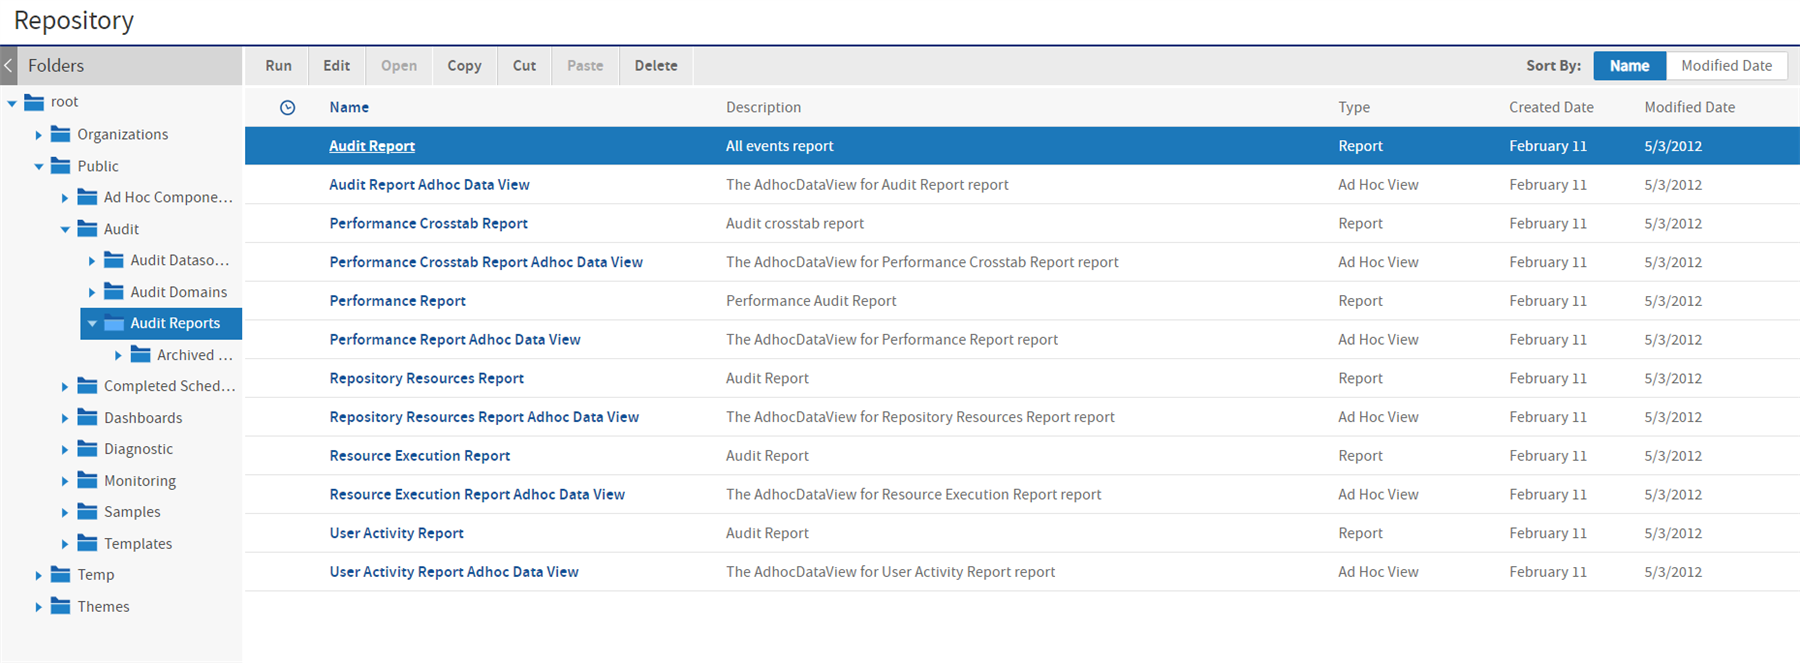
Does anyone has already tried to do the same in order to gather data on the reports generated?
Thank you,
Sébastien
Generated Image Alt-Text
[edited by: Trados AI at 6:52 AM (GMT 0) on 5 Mar 2024]

