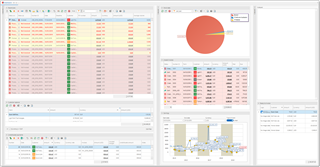
Dashboards serve as a single place to display differentiated information about your business on a single screen.

They allow to fit multiple widgets (views) on one screen, allowing to keep the most important data under control. In addition, there are a number of widgets which are available only in dashboards (not possible to open that views from navigation). For example, you can open list of jobs in a separate tab from navigation tree, but you cannot view Ready to invoice list anywhere except dashboard.
By default, the system has three dashboards, available from the Workspace section of the navigation tree:
All these dashboards are customizable, and you are free to fully replace default widgets with your own views. In addition, you can define a color for each widget for better presentation.
Among default widgets in different dashboards, you will find:
- Ongoing jobs
- Unpaid invoices
- Balance statement
- Word stats chart
- Earnings chart
- Volumes chart
- Top customers chart
- Jobs ready to invoice
- Undistributed payments
- Notepad
- Workload planner
- Undelivered assignments
- Unpaid assignments
- Active quotes
Dashboards has columnar structure. Each column can be collapsed to make other columns wider. In the same way, each widget can be collapsed vertically, to free some space for other widgets. Collapsed/expanded state is preserved between sessions. In addition, you can find splitter between all columns (horizontally) and between all widgets (vertically), which can be used to quickly change size of necessary column or widget.
Note. In some visual themes, splitter has no color and may be invisible. Simply hover mouse pointer on a border between columns and widgets to highlight splitter.
Most of widgets can be opened in full screen mode. For this, you can press View widget in full screen on the toolbar. If toolbar is hidden, press F11.

 Translate