Trados suddenly disappears after confirming a segment

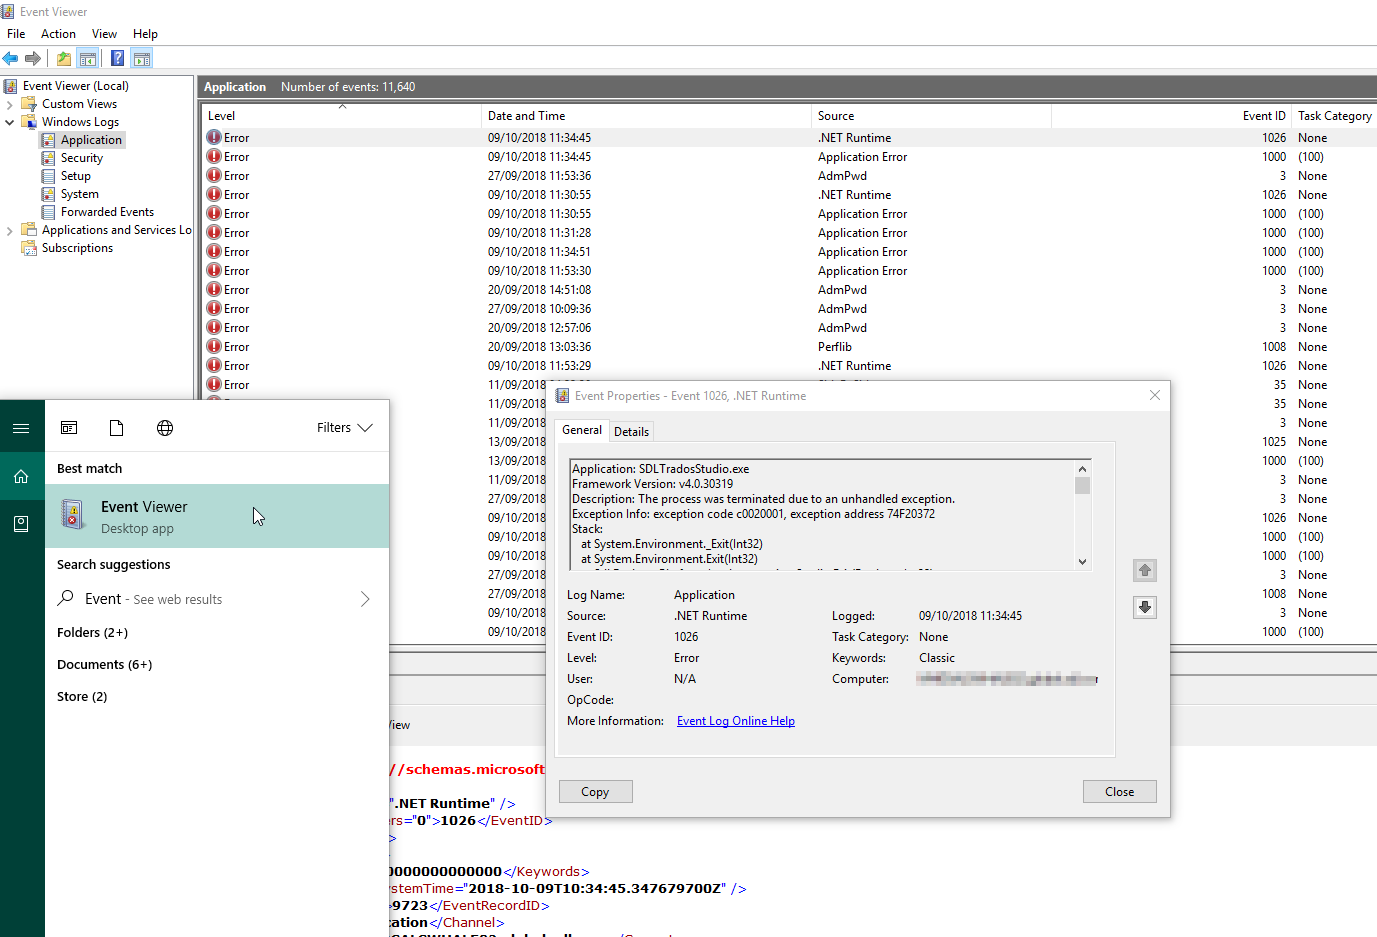
This is very strange: sometimes Trados 2017 disappears after confirming a segment. There is no error message, the application simply disappears!

When I restart Trados the memory is reasonably up to date, the file I was reviewing obviously is not up to date. I thought this was related to the 'Align new content automatically' option in large memories (disabling this option seems to prevent the issue) but now it has just occurred with a memory of just 2,000 segment (with the above option enabled).

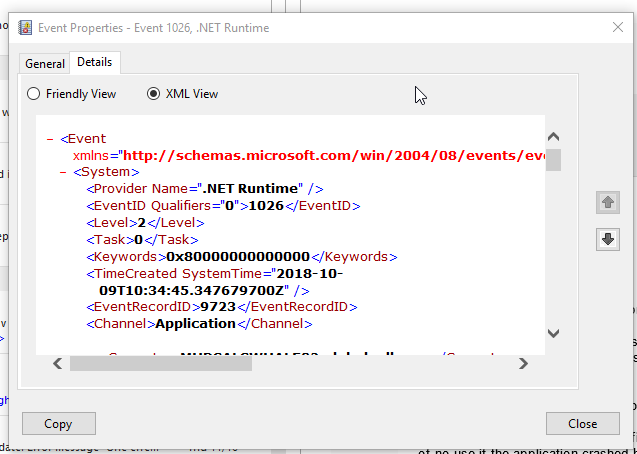
Can I find a log of what happened somewhere?

Stefano

Parents
  • Just to chime in, I've had the same problem pop up not just during the confirmation of segments, but while performing other tasks like find/replace as well. This has been a constant problem that I've detected since the before last update (the Service Pack, and the newest small update did not alleviate this issue at all). There seems to be no rhyme or reason in the crashes: there are larger periods of time when nothing happens after frequent saves and confirmations, and then there are some when it crashes every five minutes. The data sets/projects are the same.

    My only patch-up seemed to be to lower the autosave frequency to as low as 2 minutes.

      : which folder contains the log files, if they are saved? The View Log File only displays the active instance's log, which obviously is of no use if the application crashed before.


    Thanks a ton,


    Tamás Sátai

    BlackRock, Inc.

  • Hello  Tamás Sátai,

    Maybe take a look at the system log files- this may shed some light on the issue as these log every single event on the PC.

    Type in to Windows search- Event Viewer - this will then bring up the system logs going back for a long time.

    Then either scrolling through (or filtering on level) you will see all the warnings and errors and the descriptions and causes of these issues.

    Screenshot of Windows Event Viewer showing a list of system logs with multiple errors and warnings highlighted in red and yellow.

    From the details provided under General/Details- then it might be possible to understand where the error is coming from-

    Close-up of an error event properties window from .NET Runtime in the Event Viewer, displaying event ID, level, and source details.


    Lydia Simplicio | RWS Group

    _______
    Design your own training!

    You've done the courses and still need to go a little further, or still not clear? 
    Tell us what you need in our Community Solutions Hub

    emoji


    Generated Image Alt-Text
    [edited by: Trados AI at 2:30 PM (GMT 0) on 28 Feb 2024]
Reply
  • Hello  Tamás Sátai,

    Maybe take a look at the system log files- this may shed some light on the issue as these log every single event on the PC.

    Type in to Windows search- Event Viewer - this will then bring up the system logs going back for a long time.

    Then either scrolling through (or filtering on level) you will see all the warnings and errors and the descriptions and causes of these issues.

    Screenshot of Windows Event Viewer showing a list of system logs with multiple errors and warnings highlighted in red and yellow.

    From the details provided under General/Details- then it might be possible to understand where the error is coming from-

    Close-up of an error event properties window from .NET Runtime in the Event Viewer, displaying event ID, level, and source details.


    Lydia Simplicio | RWS Group

    _______
    Design your own training!

    You've done the courses and still need to go a little further, or still not clear? 
    Tell us what you need in our Community Solutions Hub

    emoji


    Generated Image Alt-Text
    [edited by: Trados AI at 2:30 PM (GMT 0) on 28 Feb 2024]
Children
No Data