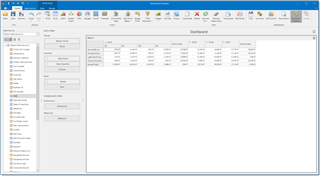
Pivot table displays cross-tabular reports and allows you to analyze multi-dimensional data.
Select the Pivot button on the ribbon, an empty pivot table will added to the workplace.
To bind the Pivot item to data, drag and drop a some field to a placeholder contained in one of the available data sections (Value, Column, Row). A table below lists and describes a Pivot data sections.
- Values
Contains data items used to calculate values displayed in the pivot table. - Columns
Contains data items whose values are used to label columns. - Rows
Contains data items whose values are used to label rows.
The Pivot dashboard item provides the capability to transpose pivot columns and rows. In this case, data items contained in the Columns section are moved to the Rows section and vice versa. To transpose the selected Pivot dashboard item, use the Transpose button in the Home ribbon tab.
Drag desired fields to a corresponding areas of the pivot grid:
You see that Date field was dragged to Columns area few times, but different detailization level was selected. It allowed to create nested Year - Quarter groups. After few clicks, we have got a table showing our margin from translation jobs in a context of different customers and year-quarter groups.
To change a name of this element, select Title button in the Dashboard group of the ribbon. Except name, you can load any image for even better visualization.
To setup conditional formatting for this pivot table, right click on it and select Edit rules. In the opened window, configure desired formatting rules to highlight points of interest in the table.

 Translate