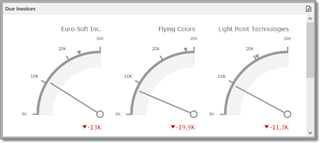
Visualizes data within a series of gauges. Each gauge can communicate two values - one with a needle and the other with a marker on the scale. The image below shows a sample Gauge dashboard item that is bound to data. It shows the difference between paid amount and full amount of invoices for each customer.
Delta
Gauges allow you to display the difference between the actual and target values of a particular parameter. This difference is called delta. Delta is shown with a delta indicator (indicating whether the actual value is less than or greater than the target value) and delta values (representing this difference as an absolute value or a variation). To customize settings that relate to the calculation and display of deltas, use the options buttons displayed next to the data item container in the Gauges section of the Data items pane. These buttons invoke the Gauge Options dialog.
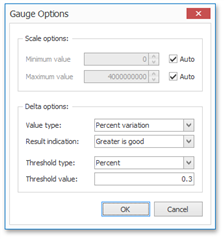
Use it to define the condition for displaying delta indication, specify which delta values should be displayed, and introduce the comparison tolerance.
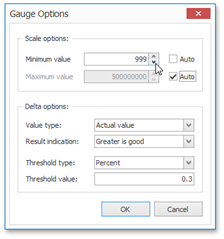
Gauge scale
By default, the Gauge item automatically determines the range of the gauge scales based on the values they display. You can override this behavior and specify maximum and minimum values on the scale. To do this, invoke the Gauge Options window using the Options button displayed in the data item container in the Gauges section of the Data items pane. In the Gauge Options window, deselect the Auto check box for the maximum or minimum value, and specify this value in the corresponding field.